


Note: This feature is available only for power meters and power sensors that support trace charts shown in the Strip Chart and Trace display views.
The Marker function enables you to place markers on the trace graph to assist you in manually determining measurement values at a specific point on the trace. The Power Meter application supports up to 5 single markers and up to 2 dual markers in a graph. You can also use this feature together with Gates.
Dual markers enable you to calculate the following pulse parameters:
On the right side of the Trace display view, a Tools Palette provides controls for the following Marker options for the Strip Chart view and Trace view.
|
|
Add up to five markers to the chart. To delete a marker, click this button again and unselect the desired marker from the drop-down list. |
|
|
Move the selected marker to the current Maximum measured value on the chart. |
|
|
Move the selected marker to the current Minimum measured value on the chart. |
|
|
Add up to five markers to the chart. To delete a marker, click this button again and unselect the desired marker from the drop-down list. |

|
Add up to two marker pairs to the chart. To delete a marker pair, click this button again and unselect the desired marker pair from the drop-down list. |

|
Add one horizontal and one vertical marker line. To delete a marker line, click this button again and unselect the desired marker from the drop-down list. |
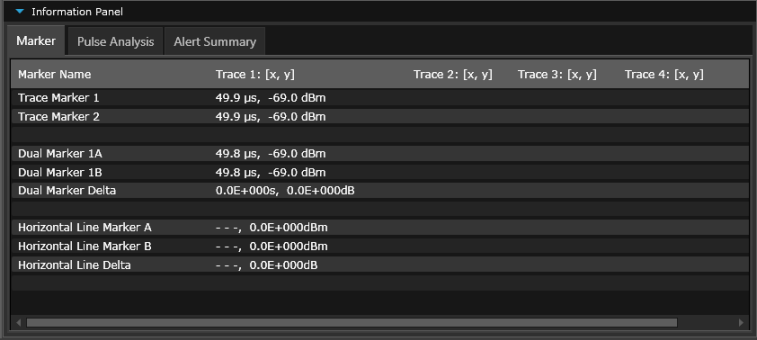
Once you have added markers to your chart, go to the Marker tab in the "Information Panel" at the bottom of the Strip Chart or Trace display view (see example below for the Trace view). The table displays the marker parameters for each trace in the current view.
Power Measurements Using Strip Chart View
Power Measurements Using Trace View